Monitoring: различия между версиями
Sirmax (обсуждение | вклад) |
Sirmax (обсуждение | вклад) |
||
| Строка 374: | Строка 374: | ||
[[Изображение:09 Nagios Core 2016-02-11 21-59-03.png|600px]] |
[[Изображение:09 Nagios Core 2016-02-11 21-59-03.png|600px]] |
||
| − | == |
+ | ==GO DEEPER!== |
| + | Next will be described all parts of LMA. |
||
| + | ===Collectd=== |
||
Collectd is collecting data, all details about collect are in separate document. |
Collectd is collecting data, all details about collect are in separate document. |
||
* [http://wiki.sirmax.noname.com.ua/index.php/Collectd Collectd in LMA detailed review] |
* [http://wiki.sirmax.noname.com.ua/index.php/Collectd Collectd in LMA detailed review] |
||
Версия 23:17, 11 февраля 2016
Monitorimg
Any complicated system need to be monitored.
LMA (Logging Monitoring Alerting) Fuel Plugins provides complex logging, monitoring
and alerting system for Mirantis Openstack. LMA use open-source products and can be also integrated with currently existing monitoring systems.
In this manual will be described complex configuration include 4 plugins:
- ElasticSearch/Kibana – Log Search, Filtration and Analysis
- LMA Collector – LMA Toolchain Data Aggregation Client
- InfluxDB/Grafana – Time-Series Event Recording and Analysis
- LMA Nagios – Alerting for LMA Infrastructure
(more details about MOS fuel plugins: MOS Plugins overview
It is possible to use LMA-related plugins separately but the are designed to be used in complex. In this document all examples are from cloud where all 4 plugins are installed and configured.
LMA DataFlow
LMA is complex system and contains the follwing parts:
- Collectd - data collecting
- Heka - data collecting and aggregation
- InluxDB - non-SQL database for time-based data, in LMA it is is used for charts in Grafana
- [https://www.elastic.co/ ElasticSearch - non-SQL database, in LMA it is used to save logs.
- Grafana - Graph and dashboard builder
- Kibana - Analytics and visualization platform
- Nagios - Monitoring system
+--------------------------------+                                                                                   Grafana dashboard                      Kibana Dashboard
|Node N (compute or controller)  |                                                                                  -------------------                 ----------------------
|                                |                                                                                           ^                                       ^
|* collectd --->---+             |                                                                                           |                                       |
|                  |             |                     +-<- Some data generated locally is looped to-<+                      |                                       |
|                  |             |                     |    to be aggregated                          |                      |                                       |
|*  hekad  <---<---+             |                     |                                              ^                      |                                       |
|    |                           |       +-------------------------------------------+                |                      ^                                       |
|    +------------->To Aggregator|------>| Heka on aggregator (Controller with VIP)  |---+------------+                      |                                       |
|    |                           |       +-------------------------------------------+                                       |                                       |
|    |                           |               |to         |to            |to                                              |                                       |
|    |                           |               |Influx     |ElasticSearch |Nagios                                          |                                       |
|    +---------------------------|->-------->--- +-------->--|------->------|--->---------->---------->--------------[ InfuxDB       ]                               ^
|    |                           |                           |              |                                                                                        |
|    |                           |                           |              |                                                                                        |
|    +---------------------------|------------------------>--+------->------|--->---------->---------->--------------[ ElasticSearch ]-------------------------------+
|                                |                                          |
+--------------------------------+                                          |
                                                                            +----------------------------------------[ Nagios ]---> Alerts (e.g. email notifications)
AFD and GSE
Overview
The process of running alarms in LMA is not centralized (like it is often the case in conventional monitoring systems) but distributed across all the Collectors.
Each Collector is individuallly responsible for monitoring the resources and the services that are deployed on the node and for reporting any anomaly or fault it may have detected to the Aggregator.
The anomaly and fault detection logic in LMA is designed more like an “Expert System” in that the Collector and the Aggregator use facts and rules that are executed within the Heka’s stream processing pipeline.
The facts are the messages ingested by the Collector into the Heka pipeline. The rules are either threshold moni- toring alarms or aggregation and correlation rules.
Both are declaratively defined in YAML(tm) files that you can modify. Those rules are executed by a collection of Heka filter plugins written in Lua that are organised according to a configurable processing workflow.
We call these plugins the AFD plugins for Anomaly and Fault Detection plugins and the GSE plugins for Global Status Evaluation plugins.
Both the AFD and GSE plugins in turn create metrics called the AFD metrics and the GSE metrics respectively.
The AFD metrics contain information about the health status of a resource like a device, a system component like a filesystem, or service like an API endpoint, at the node level.
Then, those AFD metrics are sent on a regular basis by each Collector to the Aggregator where they can be aggregated and correlated hence the name of aggregator.
E.g.
The GSE metrics contain information about the health status of a service cluster, like the Nova API endpoints cluster, or the RabbitMQ cluster as well as the clusters of nodes, like the Compute cluster or Controller cluster.
The health status of a cluster is inferred by the GSE plugins using aggregation and correlation rules and facts contained in the AFD metrics it receives from the Collectors.
Modifying CPU alarm
Modification of existing alarm is detailed explained in LMA collector plugin documentation.
So here is an example with commands, output and explanation.
Modify alarm
For test we can modify existing cpu alarm.
To be sure it always be in 'CRITICAL' state we can set cpu_idle > 100%. Of course it is just for demo.
So in /etc/hiera/override/alarming.yaml file we replace cpu idle threshold with 150 with mean '150% of cpu idle'.
lma_collector:
  alarms:
    - name: 'cpu-critical-controller'
      description: 'The CPU usage is too high (controller node).'
      severity: 'critical'
      enabled: 'true'
      trigger:
        logical_operator: 'or'
        rules:
          - metric: cpu_idle
            relational_operator: '<='
            threshold: 150
            window: 120
            periods: 0
            function: avg
<SKIP>
Next we need to run puppet to rebuild lma configuration.
puppet apply --modulepath=/etc/fuel/plugins/lma_collector-0.8/puppet/modules/ /etc/fuel/plugins/lma_collector-0.8/puppet/manifests/configure_afd_filters.pp
Heka need to be restarted so please check heka's start time:
ps -auxfw | grep heka
 ...
heka     22518  4.5  4.4 809992 134068 pts/25  Sl+  12:02   6:30              \_ hekad -config /etc/lma_collector/
root@node-6:/etc/hiera/override# date
Thu Feb 11 12:04:47 UTC 2016
On demo cluster where all command were executed heka is runing in screen and was restarted manually so output of commands may be different.
Data flow
We can follow data flow and see cpu_idle on each step. First, let's check collectd with enabled debugging. (Debugging of collectd is described detailed in Collectd document )
collectd.Values(type='cpu',type_instance='idle',plugin='cpu',plugin_instance='0',host='node-6',time=1455198002.296594,interval=10.0,values=[29482997])
Next, we can see this data in heka:
:Timestamp: 2016-02-11 12:17:12.296999936 +0000 UTC
:Type: metric
:Hostname: node-6
:Pid: 22518
:Uuid: d40bce11-ccb5-4d52-a7d0-7927424b2709
:Logger: collectd
:Payload: {"type":"cpu","values":[62.2994],"type_instance":"idle","dsnames":["value"],"plugin":"cpu","time":1455193032.297,"interval":10,"host":"node-6","dstypes":["derive"],"plugin_instance":"0"}
:EnvVersion:
:Severity: 6
:Fields:
    | name:"type" type:string value:"derive"
    | name:"source" type:string value:"cpu"
    | name:"deployment_mode" type:string value:"ha_compact"
    | name:"deployment_id" type:string value:"3"
    | name:"openstack_roles" type:string value:"primary-controller"
    | name:"openstack_release" type:string value:"2015.1.0-7.0"
    | name:"tag_fields" type:string value:"cpu_number"
    | name:"openstack_region" type:string value:"RegionOne"
    | name:"name" type:string value:"cpu_idle"
    | name:"hostname" type:string value:"node-6"
    | name:"value" type:double value:62.2994
    | name:"environment_label" type:string value:"test2"
    | name:"interval" type:double value:10
    | name:"cpu_number" type:string value:"0"
This message is sent to afd_node_controller_cpu_filter:
filter-afd_node_controller_cpu.toml:message_matcher = "(Type == 'metric' || Type == 'heka.sandbox.metric') && (Fields[name] == 'cpu_idle' || Fields[name] == 'cpu_wait')"
And filter generates alarm:
:Timestamp: 2016-02-11 13:30:46 +0000 UTC
:Type: heka.sandbox.afd_node_metric
:Hostname: node-6
:Pid: 0
:Uuid: d28b4847-310f-400d-a2ef-66b59b69cfe4
:Logger: afd_node_controller_cpu_filter
:Payload: {"alarms":[{"periods":1,"tags":{},"severity":"CRITICAL","window":120,"operator":"<=","function":"avg","fields":{},"metric":"cpu_idle","message":"The CPU usage is too high (controller node).","threshold":150,"value":50.740816666667}]}
:EnvVersion:
:Severity: 7
:Fields:
    | name:"environment_label" type:string value:"test2"
    | name:"source" type:string value:"cpu"
    | name:"node_role" type:string value:"controller"
    | name:"openstack_release" type:string value:"2015.1.0-7.0"
    | name:"tag_fields" type:string value:["node_role","source"]
    | name:"openstack_region" type:string value:"RegionOne"
    | name:"name" type:string value:"node_status"
    | name:"hostname" type:string value:"node-6"
    | name:"deployment_mode" type:string value:"ha_compact"
    | name:"openstack_roles" type:string value:"primary-controller"
    | name:"deployment_id" type:string value:"3"
    | name:"value" type:double value:3
This message is 'outputted' to nagios with nagios_afd_nodes_output plugin:
[nagios_afd_nodes_output]
type = "HttpOutput"
message_matcher = "Fields[aggregator] == NIL && Type == 'heka.sandbox.afd_node_metric'"
encoder = "nagios_afd_nodes_encoder"
<SKIP>
Result
In nagios we can see alert:

As you can see threshold is 150 as we configured:

Create new alarm
Data Flow
Data in Collectd
In Collectd we need to collect data. For example we are using Read plugin witch just read data from file.
Example of data provided by plugin:
collectd.Values(type='read_data',type_instance='read_data',plugin='read_file_demo_plugin',plugin_instance='read_file_plugin_instance',host='node-6',time=1455205416.4896111,interval=10.0,values=[888999888.0],meta={'0': True})
read_file_demo_plugin (read_data): 888999888.000000
Data in Heka
Data comes from collectd:
:Timestamp: 2016-02-11 15:45:36.490000128 +0000 UTC
:Type: metric
:Hostname: node-6
:Pid: 22518
:Uuid: ab07cf60-55b6-41c9-a530-4e88dbe6ebc8
:Logger: collectd
:Payload: {"type":"read_data","values":[889000000],"type_instance":"read_data","meta":{"0":true},"dsnames":["value"],"plugin":"read_file_demo_plugin","time":1455205536.49,"interval":10,"host":"node-6","dstypes":["gauge"],"plugin_instance":"read_file_plugin_instance"}
:EnvVersion:
:Severity: 6
:Fields:
    | name:"environment_label" type:string value:"test2"
    | name:"source" type:string value:"read_file_demo_plugin"
    | name:"deployment_mode" type:string value:"ha_compact"
    | name:"openstack_release" type:string value:"2015.1.0-7.0"
    | name:"openstack_roles" type:string value:"primary-controller"
    | name:"openstack_region" type:string value:"RegionOne"
    | name:"name" type:string value:"read_data_read_data"
    | name:"hostname" type:string value:"node-6"
    | name:"value" type:double value:8.89e+08
    | name:"deployment_id" type:string value:"3"
    | name:"type" type:string value:"gauge"
    | name:"interval" type:double value:10
Filter configuration
Configure filter manually:
- one more instance of afd.lua
[afd_node_controller_read_data_filter]
type = "SandboxFilter"
filename = "/usr/share/lma_collector/filters/afd.lua"
preserve_data = false
message_matcher = "(Type == 'metric' || Type == 'heka.sandbox.metric') && (Fields[name] == 'read_data_read_data')"
ticker_interval = 10
[afd_node_controller_read_data_filter.config]
    hostname = 'node-6'
    afd_type = 'node'
    afd_file = 'lma_alarms_read_data'
    afd_cluster_name = 'controller'
    afd_logical_name = 'read_data'
Also we need configure alarm definition (because it is new alarm. In case of existing it is generated by puppet)
File /usr/share/heka/lua_modules/lma_alarms_read_data.lua
local M = {}
setfenv(1, M) -- Remove external access to contain everything in the module

local alarms = {
  {
    ['name'] = 'cpu-critical-controller',
    ['description'] = 'Read data (controller node).',
    ['severity'] = 'critical',
    ['trigger'] = {
      ['logical_operator'] = 'or',
      ['rules'] = {
        {
          ['metric'] = 'read_data_read_data',
          ['fields'] = {
          },
          ['relational_operator'] = '<=',
          ['threshold'] = '150',
          ['window'] = '120',
          ['periods'] = '0',
          ['function'] = 'avg',
        },
      },
    },
  },
}

return alarms
Nagios Configuration
Also we need to add service and command definition to Nagios.
- Command definition (lma_services_commands.cfg)
define command {
        command_line                   /usr/lib/nagios/plugins/check_dummy 3 'No data received for at least 130 seconds'
        command_name                   return-unknown-node-6.controller.read_data
}
- Service definition (lma_services.cfg)
define service {
        active_checks_enabled          0
        check_command                  return-unknown-node-6.controller.read_data
        check_freshness                1
        check_interval                 1
        contact_groups                 openstack
        freshness_threshold            65
        host_name                      node-6
        max_check_attempts             2
        notifications_enabled          0
        passive_checks_enabled         1
        process_perf_data              0
        retry_interval                 1
        service_description            controller.read_data
        use                            generic-service
}
Results
Collectd read from file /var/log/collectd_in_data, so to check "OK" state we need to put any number > 150. 150 is threshold configured in alarm.
echo 15188899 > /var/log/collectd_in_data
So data feneratyed by plugin is:
:Timestamp: 2016-02-11 16:13:18 +0000 UTC
:Type: heka.sandbox.afd_node_metric
:Hostname: node-6
:Pid: 0
:Uuid: 7f17e0fe-d8c5-477d-a6c4-64e9234fbd93
:Logger: afd_node_controller_read_data_filter
:Payload: {"alarms":[]}
:EnvVersion:
:Severity: 7
:Fields:
    | name:"environment_label" type:string value:"test2"
    | name:"source" type:string value:"read_data"
    | name:"node_role" type:string value:"controller"
    | name:"openstack_release" type:string value:"2015.1.0-7.0"
    | name:"tag_fields" type:string value:["node_role","source"]
    | name:"openstack_region" type:string value:"RegionOne"
    | name:"name" type:string value:"node_status"
    | name:"hostname" type:string value:"node-6"
    | name:"deployment_mode" type:string value:"ha_compact"
    | name:"openstack_roles" type:string value:"primary-controller"
    | name:"deployment_id" type:string value:"3"
    | name:"value" type:double value:0
    | name:"aggregator" type:string value:"present"
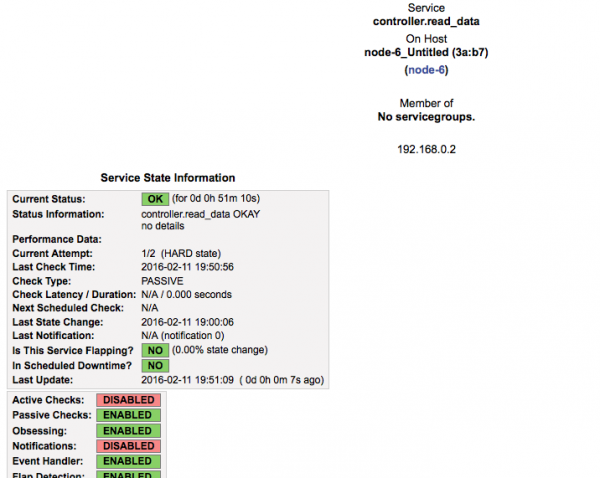
And in nagios we can see "OK" status:

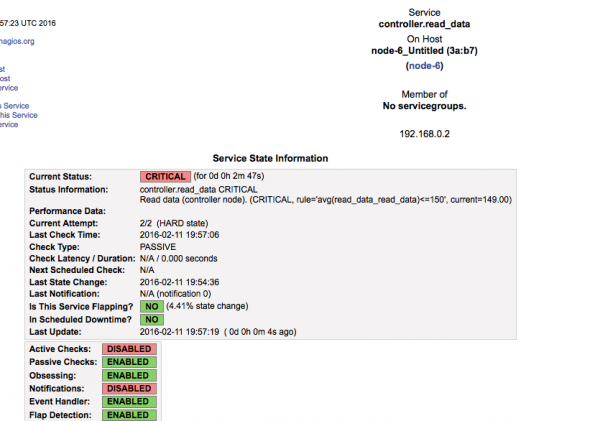
- Next, we can simulate CRITICAL state
echo 1 > /var/log/collectd_in_data
Data in heka:
:Timestamp: 2016-02-11 16:44:53 +0000 UTC
:Type: heka.sandbox.afd_node_metric
:Hostname: node-6
:Pid: 0
:Logger: afd_node_controller_read_data_filter
:Payload: {"alarms":[{"periods":1,"tags":{},"severity":"CRITICAL","window":120,"operator":"<=","function":"avg","fields":{},"metric":"read_data_read_data","message":"Read data (controller node).","threshold":150,"value":1}]}
:EnvVersion:
:Severity: 7
:Fields:
    | name:"environment_label" type:string value:"test2"
    | name:"source" type:string value:"read_data"
    | name:"node_role" type:string value:"controller"
    | name:"openstack_release" type:string value:"2015.1.0-7.0"
    | name:"tag_fields" type:string value:["node_role","source"]
    | name:"openstack_region" type:string value:"RegionOne"
    | name:"name" type:string value:"node_status"
    | name:"hostname" type:string value:"node-6"
    | name:"deployment_mode" type:string value:"ha_compact"
    | name:"openstack_roles" type:string value:"primary-controller"
    | name:"deployment_id" type:string value:"3"
    | name:"value" type:double value:3
    | name:"aggregator" type:string value:"present"
GO DEEPER!
Next will be described all parts of LMA.
Collectd
Collectd is collecting data, all details about collect are in separate document.
Heka
Heka is comolex tool so data flow in Heka is described in separate documents and divided on parts
- Heka in general
- Heka inputs details
- Heka Splitters
- Heka Decoders
- Heka debuging review
- How to create your own Heka filter, Output and Nagios integration
Kibana and Grafana
TBD
Nagios
Passive checks overview: ToBeDone!
