Heka Filter afd example
Heka Filter AFD example
Here is example of AFD (AnomalyFaultDetection) plugin.
The main idea plugin is:
- count number of incoming messages per second
- calculate average rate
- put this rate into InfluxDB and create chart in Grafana
Collecting data
To collect message rate we are using filter which called on each incoming message.
Each process_message() call just add 1 to circular buffer.
Cirular buffer
Heka's LUA SandBox has bilt-in Circular Buffer Library ehich can be used for data aggregation.
More details:
Circular buffer works like RRDTools (RRD is round-robin archive) but store data in RAM.
Simplest buffer created with <syntaxhighlight lang="lua">data1 = circular_buffer.new(60*24, 1, 60)</syntaxhighlight> looks like:
data1
+-----+-------+
|Time | Data1 |
+-----+-------+
|-Ns  |  aN   |
|...  | ...   |
|-2s  |  a3   |
|-1s  |  a2   |
|Now()|  a1   |
+-----+-------+
Arguments
- rows (unsigned) The number of rows in the buffer (must be > 1)
- columns (unsigned)The number of columns in the buffer (must be > 0)
- seconds_per_row (unsigned) The number of seconds each row represents (must be > 0).
- enable_delta (bool optional, default false) When true the changes made to the circular buffer between delta outputs are tracked.
So here we created buffer to save data during 1 day (60min*24h)
Process messages
Each message comes to filter is calling process_message() function. <syntaxhighlight lang="lua">function process_message()
   local ts = read_message("Timestamp")
   data1:add(ts, 1, 1)
   return 0
end</syntaxhighlight>
This function is very simple, it only populates circular buffer data1.
What exactly it does:
- take timestamp of message
- add 1 to raw corresponding to the timestamp
As result in 3 seconds after start data1 circular buffer looks like
data1
+-----+-------+
|Time | Data1 |
+-----+-------+
|-Ns  |  nan  |
|-N+1s|  nan  |
|...  | ...   |
|-3s  |  nan  |
|-2s  |  121  |
|-1s  |  120  |
|Now()|  12   |
+-----+-------+
in current (now()) raw we have invalid number of messages because "current second" is still "in progress". "nan" means "undefined value"
Processing collected data
The main data processing is doing timer_event(ns) function.
This function is called every ticker_interval
This function is doing the following:
- log data1 circular buffer for debug with inject_payload() call. Logged message looks like:
:Timestamp: 2016-02-05 12:45:31.985034391 +0000 UTC
:Type: heka.sandbox-output
:Hostname: node-6
:Pid: 26318
:Uuid: 6457c1de-87ef-4069-ac57-051ecdb73bca
:Logger: heartbeat_filter_lua
:Payload: {"time":1454589960,"rows":1440,"columns":1,"seconds_per_row":60,"column_info":[{"name":"Messages","unit":"count","aggregation":"sum"}]}
nan
nan
nan
<SKIP>
85
86
51

:EnvVersion:
:Severity: 7
:Fields:
    | name:"payload_type" type:string value:"cbuf_lua_test1" representation:"file-extension"
    | name:"payload_name" type:string value:""
So you can see collected data in :Payload field
- Calculates average messages rate. It may looks a little bit complicated, but please pay your attention: we DO NOT collect all messages in "currently running" second.
So instead of average = (a1+ ..+aN ) /N we need (a2+ .. +aN)/(N-1)
- Calculate difference in percents with Current messages rate and average and create alarm if needed. (For future use for alarming)
- Create debug message.
- Create message to be processed with influxdb output
function prev_time() calculates "time some steps ago" in circular buffer format. We need it because circular buffer library uses second,and time stamp is nano-seconds.
<syntaxhighlight lang="lua">function timer_event(ns)
 local Payload
 msg.Fields['lua_heartbeat_2'] = 'True'
 msg.Timestamp = ns
 inject_payload("cbuf_lua_test1", "", data1)
 avg, active_rows = data1:compute("avg", 1)
 if active_rows > 2 then
-- avg_real - avg without LAST sample -- avg = ( a1 + a2 + ... + aN ) / N -- We need to find ( a2 + ... +aN ) / (N -1) because last value may be not populated now --. --- avg_real = (a1 + a2 + ... + aN - a1/N ) * ( N/(N-1) ) -- a1 + .. + aN = avg, so: -- avg_real = ( avg - a1/N ) * ( N/( N - 1 ) ) -- N = active_rows -- a1 = data1:get(ns, 1) (Last value)
   a1 = data1:get(ns, 1)
   if a1 == nil then
-- nil means 'no messages' = 0 messages
     a1 = 0
   end
N = active_rows
.
avg_real = ( avg - (a1/active_rows) )*( N/(N-1) )
   current_percents = ( data1:get(prev_time(1, ns, data1), 1)*100 ) / avg_real
   delta_percents = math.abs(100 - current_percents )
   debug_message.Timestamp = ns
   debug_message.Fields['AVG_messages'] = avg
   debug_message.Fields['AVG_messages_real'] = avg_real
   debug_message.Fields['active_rows'] = active_rows
   debug_message.Fields['current_percents'] = current_percents
   debug_message.Fields['delta_percents']   = delta_percents
   debug_message.Fields['critical_delta']   = critical_delta
   debug_message.Fields['is_alert']         = 'False'
   inject_message(debug_message)
   influxdb_message.Timestamp = ns
   influxdb_message.Fields['payload_type'] = 'txt'
   influxdb_message.Fields['payload_name'] = 'influxdb'
-- Time is in ms
influxdb_message.Payload = "AVG_messages_real,deployment_id=3,hostname=" .. hostname .. " value="..avg_real .." " .. math.floor(ns/1000000) .. "\n"
inject_message(influxdb_message)
   if delta_percents > critical_delta then
     alert_message.Timestamp = ns
     alert_message.Fields['AVG_messages']       = avg
     alert_message.Fields['AVG_messages_real']  = avg_real
     alert_message.Fields['active_rows']      = active_rows
     alert_message.Fields['current_percents'] = current_percents
     alert_message.Fields['delta_percents']   = delta_percents
     alert_message.Fields['critical_delta']   = critical_delta
     alert_message.Fields['is_alert']         = 'True'
     inject_message(alert_message)
   end
 end
inject_message(msg)
-- return 0 end</syntaxhighlight> Messages generated with inject_message(influxdb_message) call will be processed by inluxdb-output. These messages looks like:
:Timestamp: 2016-02-05 08:00:03.152148992 +0000 UTC
:Type: heka.sandbox.HEARTBEAT
:Hostname: node-6
:Pid: 0
:Uuid: b3b3319c-0db6-47fa-a2d5-55877d489156
:Logger: heartbeat_filter_lua
:Payload: AVG_messages_real,deployment_id=3,hostname=node-6 value=51 1454659203152

:EnvVersion:
:Severity: 6
:Fields:
    | name:"payload_type" type:string value:"txt"
    | name:"payload_name" type:string value:"influxdb"
Plugin Configuration
I use the following plugin configuration:
[heartbeat_filter_lua]
type = "SandboxFilter"
filename = "/usr/share/lma_collector/filters/afd_test2.lua"
message_matcher = "Type  !~ /HEARTBEAT/ && Fields[payload_type] !~ /cbuf_lua_test1/"
ticker_interval = 1

[heartbeat_filter_lua.config]
    critical_delta = 1
    hostname = "node-6"
This is just test configuration, but it is good enough to start.
Loopback error
Please pay your attention - there is a possibility to create endless loop.
So in case we use message_matcher = "TRUE" (means "all messages") we will create endless loop because any message created by filter triggers filter call again.
[heartbeat_filter_lua]
type = "SandboxFilter"
filename = "/usr/share/lma_collector/filters/afd_test2.lua"
message_matcher = "TRUE"
ticker_interval = 1

[heartbeat_filter_lua.config]
    critical_delta = 1
Heka stops plugin with endless loop:
<SKIP>
2016/02/03 18:39:41 Plugin 'heartbeat_filter_lua' error: attempted to Inject a message to itself
2016/02/03 18:39:41 Plugin 'heartbeat_filter_lua' error: attempted to Inject a message to itself
2016/02/03 18:39:41 Plugin 'heartbeat_filter_lua' error: Terminated. Reason: timer_event() /usr/share/lma_collector/filters/afd_test2.lua:57: inject_payload() creates a circular reference (matches this plugin's message_matcher)
2016/02/03 18:39:41 Plugin 'heartbeat_filter_lua': stopped
2016/02/03 18:39:41 Plugin 'heartbeat_filter_lua': has stopped, exiting plugin without shutting down.
InfluxDB
Next step is check data in InfluxDB. Siplest way is using ipython and influxdb python client: <syntaxhighlight lang="python"> import influxdb client = influxdb.InfluxDBClient("<elastic search server's IP addrtess>", "8086", "lma_user", "lma_password") client.get_list_database()
Out[41]: [{u'name': u'_internal'}, {u'name': u'lma'}]
query = 'select value from AVG_messages_real' result = client.query(query) for i in result: print(json.dumps(i, sort_keys=True, indent=4, separators=(',', ': ') ) ) </syntaxhighlight> Output:
[
    {
        "time": "2016-02-05T08:00:02.148Z",
        "value": 51
    },
    {
        "time": "2016-02-05T08:00:03.152Z",
        "value": 51
    },
    {
        "time": "2016-02-05T08:00:04.151Z",
        "value": 51
    }
]
Grafana
Now we can create simple chart in Grafana:
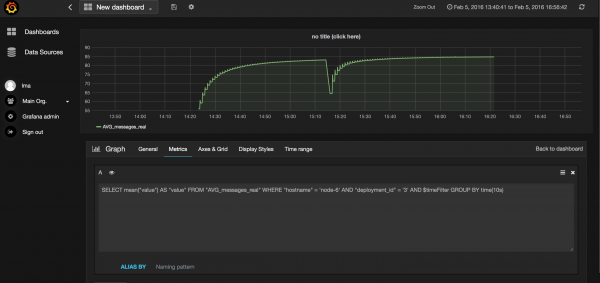
As you can see on screenshot we use following request to build chart:
SELECT mean("value") AS "value" FROM "AVG_messages_real" WHERE "hostname" = 'node-6' AND "deployment_id" = '3' AND $timeFilter GROUP BY time(10s)
More details about Grafana is in Plugin Documentation
ElasticSearch
Also it is possible to sens data to ElasticSearch. We need it only if we would like save logs. Test plugin do not generate any log, but anyway it is possible to send it to ElasticSearch and see in Kibana Dashboard
Send data to ElasticSearch
First we need to check ElasticSearch output plugin configuration:
[elasticsearch_output]
type = "ElasticSearchOutput"
message_matcher = "Type == 'log' || Type  == 'notification'"
encoder = "elasticsearch_encoder"
flush_interval = 5000
flush_count = 10
server = "http://192.168.0.3:9200"
use_buffering = false
As we can see, message_matcher will not match any of messages generated by plugin.
All messages have Type="heka.sandbox.HEARTBEAT"
So first we need to modify message_matcher in elasticsearch output plugin configuration:
message_matcher = "Type == 'log' || Type == 'notification' || Type =~ /heartbeat/ "
Type of message is used for index name so it must be lower case. So, second step is modify plugin code to use lower case in Type field and add additional fields.
<syntaxhighlight lang="lua">local debug_message = {
   Type = "heartbeat",
   Timestamp = nil,
   Severity = 6,
   Fields = {}
} <SKIP>
   debug_message.Timestamp = ns
   debug_message.Payload = 'AVG_messages: ' .. avg .. ' AVG_messages_real: ' ..  avg_real .. ' active_rows:' ..  active_rows .. ' current_percents:' .. current_percents .. ' delta_percents:' .. delta_percents .. ' critical_delta:' .. critical_delta .. ' is_alert' ..  ' False \n'
   debug_message.Fields['deployment_mode'] = "ha_compact"
   debug_message.Fields['environment_label'] = "test2"
   debug_message.Fields['openstack_region'] = "RegionOne"
   debug_message.Fields['deployment_id'] = "3"
   debug_message.Fields['severity_label'] = "INFO"
   debug_message.Fields['programname'] = "hekad"
   debug_message.Fields['openstack_roles'] = "primary-controller"
   debug_message.Fields['openstack_release'] = "2015.1.0-7.0"
inject_message(debug_message)
</syntaxhighlight>
Check data in ElasticSearch
To check do we send valid data and was it saved in ElasticSearch we can directly send request to ElasticSearch engine. In example below we sent request from mode where ElasticSearch is running, so we use localhost as ElasticSearch endpoint.
curl -XGET 'http://127.0.0.1:9200/_search?size=1' -d '
{
    "query" : {
         "match" : {
            "Severity" : 6
         }
     }
}' | python -m json.tools
Example of output:
            {
                "_id": "AVKyN83PDm8nP0Qg-76A",
                "_index": "heka.sandbox.heartbeat-2016.02.05",
                "_score": 1.0,
                "_source": {
                    "EnvVersion": "",
                    "Hostname": "node-6",
                    "Logger": "heartbeat_filter_lua",
                    "Payload": "AVG_messages: 80.666666666667 AVG_messages_real: 82.25 active_rows:9 current_percents:105.77507598784 delta_percents:5.7750759878419 critical_delta:1 is_alert False",
                    "Pid": 0,
                    "Severity": 6,
                    "Timestamp": "2016-02-05T16:15:42",
                    "Type": "heka.sandbox.heartbeat",
                    "Uuid": "f76e534a-fede-4d10-a5ca-1fea89a196e2",
                    "deployment_id": "3",
                    "deployment_mode": "ha_compact",
                    "environment_label": "test2",
                    "openstack_region": "RegionOne",
                    "openstack_release": "2015.1.0-7.0",
                    "openstack_roles": "primary-controller",
                    "programname": "hekad",
                    "severity_label": "INFO"
                },
                "_type": "message"
            },
So we can see data saved in ElasticSearch. More details: http://okfnlabs.org/blog/2013/07/01/elasticsearch-query-tutorial.html
Kibana
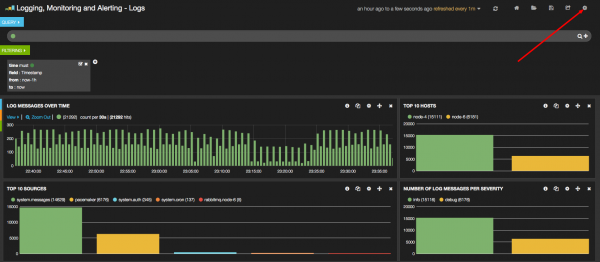
To fing logs created by plugin in Kibana we need to do the following:
- Go to dashboard config (click n gear):
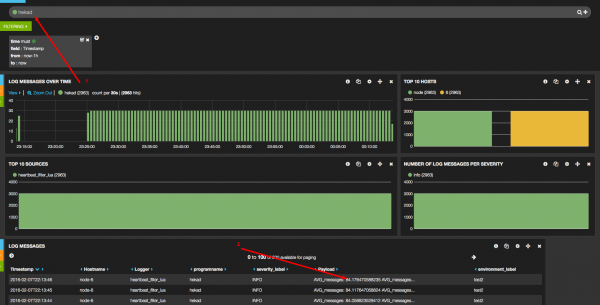
- Go to "Index" tab (1), check none/_all in index (3) and save (4)
- Find your logs, e.g. using hekad keyword or AVG keyword
Nagios
Finally we need to create alert in nagios and send data ti nagios via API.
Nagios configuration
In situations, where you cannot use send_nsca for submitting passive check results over the network, you can use the Nagios web interface.
In our case it is much faster not to use external tools like 'send_nsca' Anyway, it still possible and will be described below in nsca section
- Define command (dummy) wich always return "warning":
define command {
        command_line                   /usr/lib/nagios/plugins/check_dummy 3 'No data received for at least 130 seconds'
        command_name                   return-unknown-node-6-message-rate


}
- Define service:
define service {
        active_checks_enabled          0
        check_command                  return-unknown-node-6-message-rate
        check_freshness                1
        check_interval                 1
        contact_groups                 openstack
        freshness_threshold            65
        host_name                      node-6
        max_check_attempts             2
        notifications_enabled          0
        passive_checks_enabled         1
        process_perf_data              0
        retry_interval                 1
        service_description            heka-nodes.message-rate
        use                            generic-service
}
- Restart nagios (service nagios3 restart)
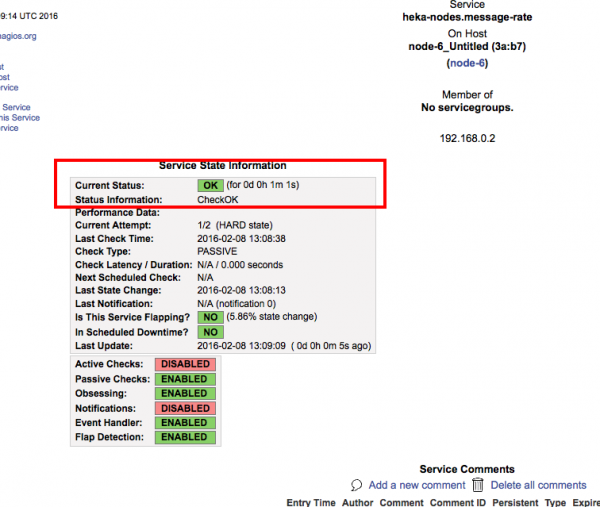
- Check services (new service is in 'PENDING' state)
- Manually send data to nagios
#!/bin/bash

NAGIOS_URL="http://192.168.0.3:8001/cgi-bin/cmd.cgi"
HOST="node-6"
SERVICE="heka-nodes.message-rate"
curl -v -u "nagiosadmin:r00tme" \
"${NAGIOS_URL}?cmd_typ=30&cmd_mod=2&host=${HOST}&service=${SERVICE}&plugin_state=0&plugin_output=CheckOK&btnSubmit=Commit"
NAGIOS_URL login and password can be found in heka nagios output plugin configuration (/etc/lma_collector/output-nagios_gse_global_clusters.toml) Expected result is code 200:
* Hostname was NOT found in DNS cache
*   Trying 192.168.0.3...
* Connected to 192.168.0.3 (192.168.0.3) port 8001 (#0)
* Server auth using Basic with user 'nagiosadmin'
> HEAD /cgi-bin/cmd.cgi?cmd_typ=30&cmd_mod=2&host=node-6&service=heka-nodes.message-rate&plugin_state=0&plugin_output=CheckOK&btnSubmit=Commit HTTP/1.1
> Authorization: Basic bmFnaW9zYWRtaW46cjAwdG1l
> User-Agent: curl/7.35.0
> Host: 192.168.0.3:8001
> Accept: */*
>
< HTTP/1.1 200 OK
HTTP/1.1 200 OK
< Date: Mon, 08 Feb 2016 13:08:38 GMT
Date: Mon, 08 Feb 2016 13:08:38 GMT
* Server Apache/2.4.7 (Ubuntu) is not blacklisted
< Server: Apache/2.4.7 (Ubuntu)
Server: Apache/2.4.7 (Ubuntu)
< Vary: Accept-Encoding
Vary: Accept-Encoding
< Connection: close
Connection: close
< Content-Type: text/html
Content-Type: text/html
Plugin modification
To send data to nagios we need to modify plugin in following way: <syntaxhighlight lang="lua"> local nagios_message = {
   Type = "simple_nagios",
   Timestamp = nil,
   Severity = 6,
   Fields = {},
   Payload = ""
}
<SKIP>
     nagios_message.Timestamp = ns
     nagios_message.Fields['AVG_messages']       = avg
     nagios_message.Fields['AVG_messages_real']  = avg_real
     nagios_message.Fields['active_rows']      = active_rows
     nagios_message.Fields['current_percents'] = current_percents
     nagios_message.Fields['delta_percents']   = delta_percents
     nagios_message.Fields['critical_delta']   = critical_delta
     nagios_message.Fields['service']          = "heka-nodes.message-rate"
     nagios_message.Payload= "heka-nodes.message-rate"
nagios_message.Fields['is_alert'] = 'False'
   if delta_percents > critical_delta then
      <SKIP>
     nagios_message.Fields['is_alert']         = 'True'
      <SKIP>
   end
   inject_message(nagios_message)
</syntaxhighlight>
Final plugin configuration:
[heartbeat_filter_lua]
type = "SandboxFilter"
filename = "/usr/share/lma_collector/filters/afd_test2.lua"
#message_matcher = "TRUE"
#message_matcher = "Type != 'HEARTBEAT'"
message_matcher = "Type  !~ /HEARTBEAT/ && Fields[payload_type] !~ /cbuf_lua_test1/ && Type !~ /heartbeat/ && Type !~ /simple_nagios/"
#ticker_interval = 120
#preserve_data = false
ticker_interval = 1

[heartbeat_filter_lua.config]
    critical_delta = 20
    hostname = "node-6"
Simple Nagios Encoder
To send data to nagios we need to create (or 'encode' in terms of Heka) URL string and use HTTP output plugin.
In LMA there is nagios encoder, but we need simple one and this is just example how can be decider created.
<syntaxhighlight lang="lua">require "string"require "string"
function process_message ()
   local hostname = read_message("Hostname")
   local logger   = read_message("Logger")
   local is_alert = read_message("Fields[is_alert]")
   local service  = read_message("Fields[service]")
   local plugin_state="0"
   local plugin_output="CheckOK"
   if is_alert == "True" then
      plugin_state="2"
      plugin_output="CheckCritical"
    end
    if service == nil then.
       service = 'nil_service'
    end
    if hostname == nil then.
       hostname = 'nil_service'
    end
-- "cmd_typ=30&cmd_mod=2&host=${HOST}&service=${SERVICE}&plugin_state=0&plugin_output=CheckOK&btnSubmit=Commit"
   if is_alert == "True" or is_alert == "False" then
   inject_payload("txt", "test_payload",
                   string.format("cmd_typ=30&cmd_mod=2&host=%s&service=%s&plugin_state=%s&plugin_output=%s&btnSubmit=Commit", hostname, service, plugin_state, plugin_output))
    end
   return 0
end
</syntaxhighlight>
Decoder configuration have 2 sections - first sends data to file for debugging, and second is for sending data to nagios.
Send data to file:
[nagios_simple]
type = "FileOutput"
message_matcher = "Fields[aggregator] == NIL && Type =~ /simple_nagios/  && ( Fields[is_alert] == 'True' || Fields[is_alert] == 'False' )"
path = "/var/log/heka-simple-nagios.log"
perm = "666"
encoder = "simple_nagios_encoder"
Send data to nagios:
[nagios_simple_http]
type = "HttpOutput"
message_matcher = "Fields[aggregator] == NIL && Type =~ /simple_nagios/  && ( Fields[is_alert] == 'True' || Fields[is_alert] == 'False' )"
encoder = "simple_nagios_encoder"
address = "http://192.168.0.3:8001/cgi-bin/cmd.cgi"
username = "nagiosadmin"
password = "r00tme"
http_timeout = 2000
method = "POST"
 [nagios_simple_http.headers]
     Content-Type = ["application/x-www-form-urlencoded"]
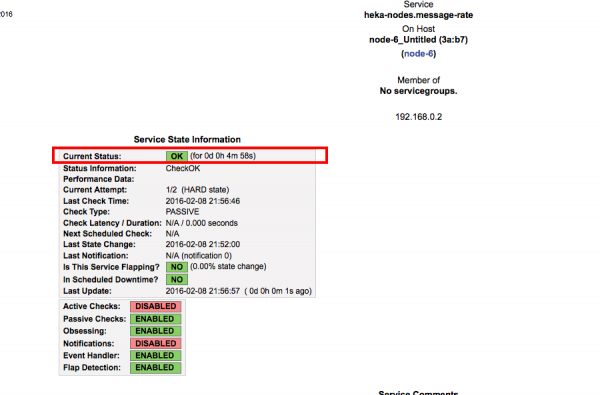
Debug and results
With tcpflowtool you can see requests:
POST /cgi-bin/cmd.cgi HTTP/1.1
Host: 192.168.0.3:8001
User-Agent: Go 1.1 package http
Content-Length: 124
Authorization: Basic bmFnaW9zYWRtaW46cjAwdG1l
Content-Type: application/x-www-form-urlencoded
Accept-Encoding: gzip

cmd_typ=30&cmd_mod=2&host=node-6&service=heka-nodes.message-rate&plugin_state=2&plugin_output=CheckCritical&btnSubmit=Commit
NSCA
There is another way to send data to nagios: use NSCA.
NSCA (Nagios Service Check Acceptor) is a Linux/Unix daemon allows you to integrate passive alerts and checks from remote machines and applications with Nagios.
It is not possible to use os module in filters because of Heka's Sandbox limitations (or you need recompile sandbox module), but it is possible to use it in output.
So another way to send data to the nagios server is create output plugin which calls external binary file.
Notice: by-default nagios server does not accept NSCA messages, so you need enable nsca service and allow incoming connections to nsca port:
service nsca start
iptables -I INPUT -m tcp -p tcp --dport 5667 -j ACCEPT
Plugin configuration is simple:
[simple_nsca]
type = "SandboxOutput"
filename = "/usr/share/lma_collector/outputs/exec.lua"
message_matcher = "Fields[aggregator] == NIL && Type =~ /simple_nagios/  && ( Fields[is_alert] == 'True' || Fields[is_alert] == 'False' )"
  [lastfile_simple_1.config]
  nagios_server = "192.168.0.3"
Output plugin code: <syntaxhighlight lang="lua">require "io" require "os" require "string"
local nagios_server = read_config('nagios_server') or error('path required') function process_message()
   local hostname = read_message("Hostname")
   local logger   = read_message("Logger")
   local is_alert = read_message("Fields[is_alert]")
   local service  = read_message("Fields[service]")
   local plugin_state="0"
   local plugin_output="CheckOK"
   if is_alert == "True" then
      plugin_state="2"
      plugin_output="CheckCritical"
    end
    if service == nil then
       service = 'nil_service'
    end
    if hostname == nil then
       hostname = 'nil_service'
    end
   if is_alert == "True" or is_alert == "False" then
     os.execute(string.format("echo  %s:%s:%s:%s | /usr/sbin/send_nsca  -H %s -d : -c /etc/send_nsca.cfg" ,hostname, service, plugin_state, plugin_output, nagios_server))
-- debug
os.execute(string.format("echo %s:%s:%s:%s /usr/sbin/send_nsca -H %s -d : -c /etc/send_nsca.cfg >> /tmp/nagios_debug" ,hostname, service, plugin_state, plugin_output, nagios_server))
    end
   return 0
end </syntaxhighlight>
Of course it is slower compared with http requests but it is only way to send data using pre-compiled propriety tools to existing propriety monitoring systems.
Plugin code
Basic version (v1)
This is basic vesion w/o nagios code <syntaxhighlight lang="lua">require "string" require "math"
require "circular_buffer"
-- 60 min * 24h = 1 day, 1 row 60 sec per row
data1 = circular_buffer.new(60*24, 1, 60)
local COUNT1 = data1:set_header(1, "Messages", "count", "sum")
local critical_delta = read_config('critical_delta') or error('critical_delta must be specified!')
local hostname = read_config('hostname') or error('hostname must be specified!')
local c=0
local msg = {
   Type = "HEARTBEAT",
   Timestamp = nil,
   Severity = 6,
   Fields = {}
}
local debug_message = {
   Type = "HEARTBEAT",
   Timestamp = nil,
   Severity = 6,
   Fields = {}
}
local alert_message = {
   Type = "HEARTBEAT",
   Timestamp = nil,
   Severity = 6,
   Fields = {}
}
local influxdb_message = {
   Type = "HEARTBEAT",
   Timestamp = nil,
   Severity = 6,
   Fields = {},
   Payload = ""
}
function prev_time(step, ts, cbuf)
 rows, columns, seconds_per_row = cbuf:get_configuration()
 return ts - (1000000000 * seconds_per_row * step)
end
function process_message()
   local ts = read_message("Timestamp")
   data1:add(ts, 1, 1)
   return 0
end
function timer_event(ns)
 local Payload
 msg.Fields['lua_heartbeat_2'] = 'True'
 msg.Timestamp = ns
 inject_payload("cbuf_lua_test1", "", data1)
 avg, active_rows = data1:compute("avg", 1)
 if active_rows > 2 then
-- avg_real - avg without LAST sample -- avg = ( a1 + a2 + ... + aN ) / N -- We need to find ( a2 + ... +aN ) / (N -1) because last value may be not populated now -- --- avg_real = (a1 + a2 + ... + aN - a1/N ) * ( N/(N-1) ) -- a1 + .. + aN = avg, so: -- avg_real = ( avg - a1/N ) * ( N/( N - 1 ) ) -- N = active_rows -- a1 = data1:get(ns, 1) (Last value)
   a1 = data1:get(ns, 1)
   if a1 == nil then
-- nil means 'no messages' = 0 messages
     a1 = 0
   end
N = active_rows
avg_real = ( avg - (a1/active_rows) )*( N/(N-1) )
   current_percents = ( data1:get(prev_time(1, ns, data1), 1)*100 ) / avg_real
   delta_percents = math.abs(100 - current_percents )
   debug_message.Timestamp = ns
   debug_message.Fields['AVG_messages'] = avg
   debug_message.Fields['AVG_messages_real'] = avg_real
   debug_message.Fields['active_rows'] = active_rows
   debug_message.Fields['current_percents'] = current_percents
   debug_message.Fields['delta_percents']   = delta_percents
   debug_message.Fields['critical_delta']   = critical_delta
   debug_message.Fields['is_alert']         = 'False'
   inject_message(debug_message)
   influxdb_message.Timestamp = ns
   influxdb_message.Fields['payload_type'] = 'txt'
   influxdb_message.Fields['payload_name'] = 'influxdb'
-- Time is in ms
influxdb_message.Payload = "AVG_messages_real,deployment_id=3,hostname=" .. hostname .. " value="..avg_real .." " .. math.floor(ns/1000000) .. "\n"
inject_message(influxdb_message)
   if delta_percents > critical_delta then
     alert_message.Timestamp = ns
     alert_message.Fields['AVG_messages']       = avg
     alert_message.Fields['AVG_messages_real']  = avg_real
     alert_message.Fields['active_rows']      = active_rows
     alert_message.Fields['current_percents'] = current_percents
     alert_message.Fields['delta_percents']   = delta_percents
     alert_message.Fields['critical_delta']   = critical_delta
     alert_message.Fields['is_alert']         = 'True'
     inject_message(alert_message)
   end
 end
inject_message(msg)
-- return 0 end</syntaxhighlight>
Final version
<syntaxhighlight lang="lua">require "string" require "math"
require "circular_buffer"
-- 60 min * 24h = 1 day, 1 row 60 sec per row
data1 = circular_buffer.new(60*24, 1, 60)
local COUNT1 = data1:set_header(1, "Messages", "count", "sum")
local critical_delta = read_config('critical_delta') or error('critical_delta must be specified!')
local hostname = read_config('hostname') or error('hostname must be specified!')
local c=0
local msg = {
   Type = "HEARTBEAT",
   Timestamp = nil,
   Severity = 6,
   Fields = {}
}
local debug_message = {
   Type = "heartbeat",
   Timestamp = nil,
   Severity = 6,
   Fields = {}
}
local nagios_message = {
   Type = "simple_nagios",
   Timestamp = nil,
   Severity = 6,
   Fields = {},
   Payload = ""
}
local alert_message = {
   Type = "HEARTBEAT",
   Timestamp = nil,
   Severity = 6,
   Fields = {}
}
local influxdb_message = {
   Type = "HEARTBEAT",
   Timestamp = nil,
   Severity = 6,
   Fields = {},
   Payload = ""
}
function prev_time(step, ts, cbuf)
 rows, columns, seconds_per_row = cbuf:get_configuration()
 return ts - (1000000000 * seconds_per_row * step)
end
function process_message()
   local ts = read_message("Timestamp")
   data1:add(ts, 1, 1)
   return 0
end
function timer_event(ns)
 local Payload
 msg.Fields['lua_heartbeat_2'] = 'True'
 msg.Timestamp = ns
-- inject_payload("cbuf_lua_test1", "", data1)
 avg, active_rows = data1:compute("avg", 1)
 if active_rows > 2 then
-- avg_real - avg without LAST sample -- avg = ( a1 + a2 + ... + aN ) / N -- We need to find ( a2 + ... +aN ) / (N -1) because last value may be not populated now -- --- avg_real = (a1 + a2 + ... + aN - a1/N ) * ( N/(N-1) ) -- a1 + .. + aN = avg, so: -- avg_real = ( avg - a1/N ) * ( N/( N - 1 ) ) -- N = active_rows -- a1 = data1:get(ns, 1) (Last value)
   a1 = data1:get(ns, 1)
   if a1 == nil then
-- nil means 'no messages' = 0 messages
     a1 = 0
   end
N = active_rows
avg_real = ( avg - (a1/active_rows) )*( N/(N-1) )
a2=data1:get(prev_time(1, ns, data1),1)
-- a2 = 0
   current_percents = ( data1:get(prev_time(1, ns, data1), 1)*100 ) / avg_real
   delta_percents = math.abs(100 - current_percents )
   debug_message.Timestamp = ns
   debug_message.Payload =
      'AVG_messages: ' .. avg .. ' AVG_messages_real: ' ..  avg_real .. 'a2: ' .. a2 ..' active_rows:' .. active_rows ..
      ' current_percents:' .. current_percents .. ' delta_percents:' .. delta_percents .. ' critical_delta:' .. critical_delta .. ' is_alert:' ..  ' False \n'
   debug_message.Fields['deployment_mode'] = "ha_compact"
   debug_message.Fields['environment_label'] = "test2"
   debug_message.Fields['openstack_region'] = "RegionOne"
   debug_message.Fields['deployment_id'] = "3"
   debug_message.Fields['severity_label'] = "INFO"
   debug_message.Fields['programname'] = "hekad"
   debug_message.Fields['openstack_roles'] = "primary-controller"
   debug_message.Fields['openstack_release'] = "2015.1.0-7.0"
inject_message(debug_message)
   influxdb_message.Timestamp = ns
   influxdb_message.Fields['payload_type'] = 'txt'
   influxdb_message.Fields['payload_name'] = 'influxdb'
-- Time is in ms
influxdb_message.Payload = "AVG_messages_real,deployment_id=3,hostname=" .. hostname .. " value="..avg_real .." " .. math.floor(ns/1000000) .. "\n"
inject_message(influxdb_message)
     nagios_message.Timestamp = ns
     nagios_message.Fields['a2'] =  a2
     nagios_message.Fields['AVG_messages']       = avg
     nagios_message.Fields['AVG_messages_real']  = avg_real
     nagios_message.Fields['active_rows']      = active_rows
     nagios_message.Fields['current_percents'] = current_percents
     nagios_message.Fields['delta_percents']   = delta_percents
     nagios_message.Fields['critical_delta']   = critical_delta
     nagios_message.Fields['service']          = "heka-nodes.message-rate"
     nagios_message.Payload= "heka-nodes.message-rate"
nagios_message.Fields['is_alert'] = 'False'
   if delta_percents > critical_delta then
     alert_message.Timestamp = ns
     alert_message.Fields['AVG_messages']       = avg
     alert_message.Fields['AVG_messages_real']  = avg_real
     alert_message.Fields['active_rows']      = active_rows
     alert_message.Fields['current_percents'] = current_percents
     alert_message.Fields['delta_percents']   = delta_percents
     alert_message.Fields['critical_delta']   = critical_delta
     alert_message.Fields['is_alert']         = 'True'
     nagios_message.Fields['is_alert']         = 'True'
     inject_message(alert_message)
   end
   inject_message(nagios_message)
 end
-- inject_message(msg) -- return 0 end</syntaxhighlight>
